Operational monitoring
MONITORING OPERATIONAL DISTURBANCES

Full
Visibility
By ingesting all log data from Boomi and Azure SQL over global locations, Ionis Pharmaceuticals gained full visibility of their business processes. Additionally, log data from their Azure SQL for additional observability of database activity allowing them to predict and isolate disturbances.

Operational
Posture
Having gained full observability of all employees and servers across all global locations, Ionis Pharmaceuticals has full real-time visibility of their operational posture with out-of-the-box analytics apps for Boomi and Azure SQL.

Faster Disturbances
detection
Machine learning-based analytics and alerting reduced meantime to detection by 90%. Full text search across all data and granular contextual 360 views into every user and entity lead to significantly faster detection and remediation. With no practical limit to data retention, all historical data is immediately available making remediation across the network significantly faster.
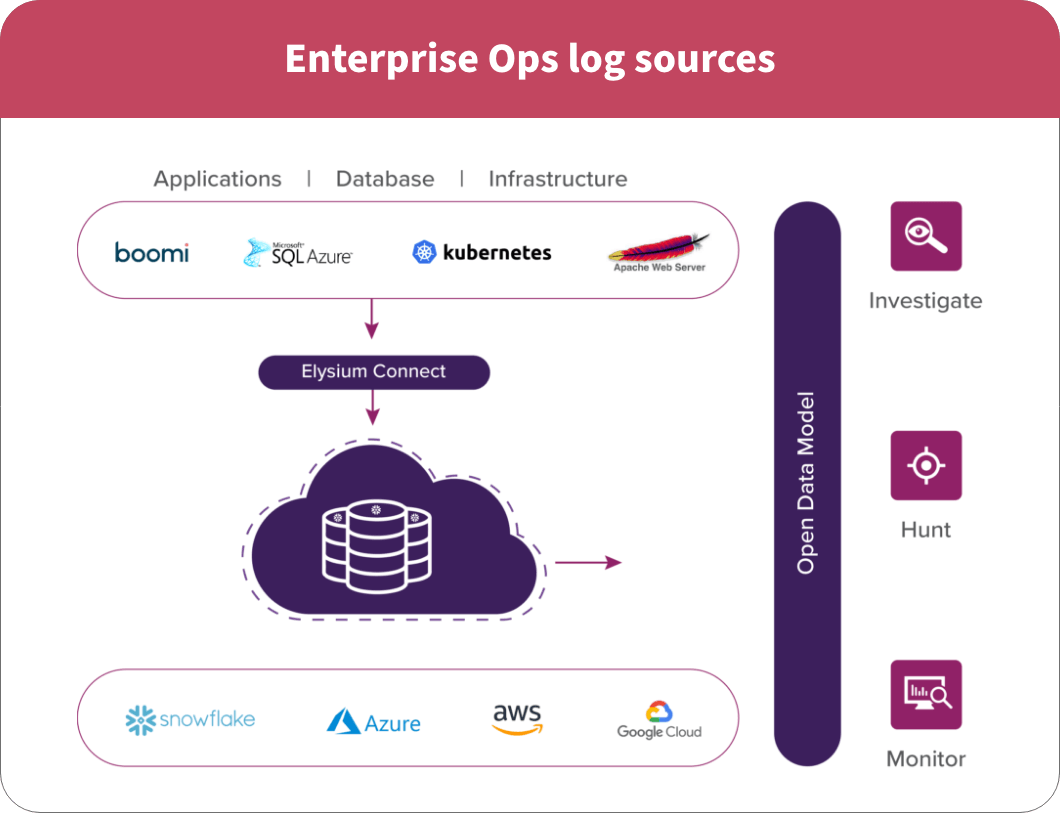
DATA COLLECTION FLOW
Data Collection: Near real-time data collection and shipping is facilitated by connecting to the Elysium Analytics collector service,

With the data collection configured and the parsing and data mapping verified, data was immediately loading to Snowflake giving Ionis Pharmaceuticals full visibility to activity on the endpoints and network on our included out-of-the-box dashboards. This gave them immediate visibility to possible vulnerabilities and Disturbances on their network as well as the ability to do full text search on any data.
SOLUTION ARCHITECTURE
(Operational Logs)

Operational log data lake for all enterprise log data

Open data model connecting and enriching the data for context

Enable modern connected applications for alerting, investigation, monitoring

Zero data engineering, zero operations, zero impact on existing security implementations
THE DASHBOARDS OF IMMEDIATE INTEREST WERE
Operational Posture: Enterprise situational awareness dashboard to view key security indicators that are critical network events to be investigated. It shows outlier events/total volume trend and shows top events and top notable event sources.

OPERATIONAL
DISTURBANCE DETECTION

CUSTOM DASHBOARDS
Elysium Analytics bundles both Kibana and Looker, giving Ionis Pharmaceuticals not only access to out-of-the-box dashboards and analytics that are included in the solution but also provides the ability to customize or build their own dashboards at no additional charge. Typically, a BI application license would run well in excess of $100,000 per year and require significant set up efforts before you can run analytics on your data warehouse. With Looker already implemented as a part of the Elysium Analytics solution and with parsing and data mapping in place, Ionis Pharmaceuticals were able to quickly develop custom dashboards specific to their environment and use cases on Looker with minimal effort, no contract negotiations or up-front license expense, billed at the standard usage-based rate.